Process systemd-logind constant 3-7%CPU usage, scanning camera and audio devices

REPRODUCIBILITY (% or how often): 80%
BUILD ID = OS VERSION (Settings > About product): 4.2.0.21 (Verla)
HARDWARE (XA2, X10, X10 II, …): X10DS
UI LANGUAGE: en
REGRESSION: (compared to previous public release: Yes, No, ?): ?

DESCRIPTION:

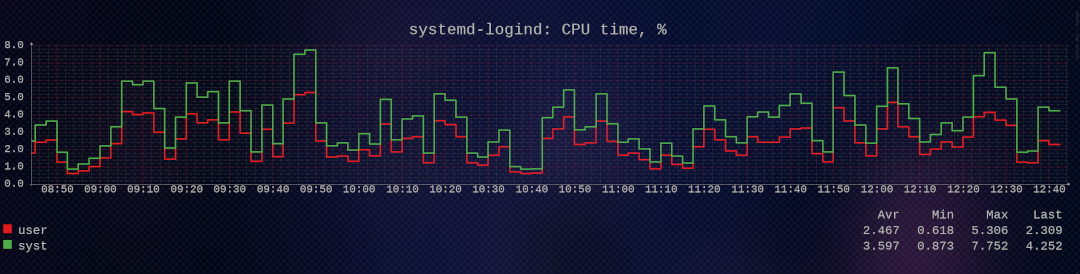
Several monitoring tools (ps, dstat, top, htop, collectd/systemdatascope…) show systemd-logind eating resources all the time.

Not much, but constantly.

Here’s what collectd/systemdatascope produce:

UPDATE1: It appears the phenomenon appeards while the display is OFF, not during normal use (obseved while logged in over ssh).

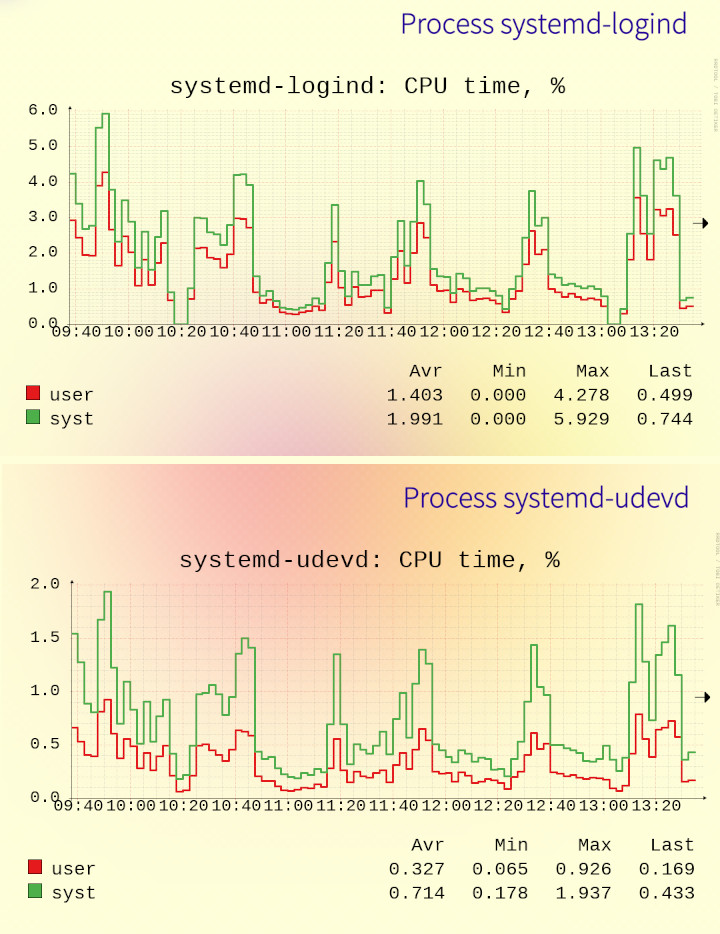
UPDATE2: Udevd is involved as well, if I read my graphs correctly - spikes are very similar.
Screenshot:

PRECONDITIONS:

unknown

STEPS TO REPRODUCE:

  1. have systemd-logind active (hehe)
  2. monitor CPU or I/O usage using your preferred method
  3. notice constant acticity

EXPECTED RESULT:

Which amount of load this should cause in order to be doing what it must be doing is unknown to me, but it shouldn’t actually have to do a lot on a single-user system like a SFOS phone.

ACTUAL RESULT:

3-5% CPU usage by the systemd-logind process all the time.

I also see the device not being able to put all CPUS to sleep, which might or might not be related.

Also, htop shows a particular IRQ thread busy a lot, which may or may not be related.
Kernel thread name: irq/30-1008000.
Info according to proc/interrups: 30: 17464269 0 mpm-gic 215 Level 1008000.qcom,cpu-bwmon

ADDITIONAL INFORMATION:

Using strace I find that it’s apparently looping over files (symlinks?) under
/sys/devices/platform/soc/soc, mainly sound and camera devices.

I have run something like

strace -e file -w -C -p 2910 2>&1

which results in:

strace: Process 2910 detached
% time     seconds  usecs/call     calls    errors syscall
------ ----------- ----------- --------- --------- ----------------
 71.81    1.616770          43     37206           openat
 11.05    0.248774          54      4573           readlinkat
  8.12    0.182891          60      3007           access
  4.89    0.110015          76      1441           setxattr
  3.04    0.068464          47      1441           getxattr
  0.77    0.017396         527        33           rename
  0.16    0.003695         111        33        33 mkdir
  0.16    0.003571         108        33           lstat64
------ ----------- ----------- --------- --------- ----------------
100.00    2.251576          47     47767        33 total

Strace outputs:

If you do a grep ^access trace_file.log | sort | uniq -c you will find the same 131 files are accessed 16 times in the time that strace ran.

6 Likes

In case it is related, that interrupt increases its spurious count by about 200-300 per second:

 # while sleep 1 ; do awk '/count/ {print systime(),  $2}'  /proc/irq/30/spurious; done
1636633234 81830
1636633235 82072
1636633236 82324
1636633237 82560
1636633238 82819
1636633249 83052
1636633257 83297
1636633258 83547
1636633259 83796
1636633260 84046
1636633261 84292
1636633262 84537
1636633263 84793
^C

It is not normal. By documentation, it provides D-Bus api “mplementing a shutdown/sleep inhibition logic for application”. It is possible that some application uses it. Try D-Bus monitor to find more…

1 Like

UPDATE1: It appears the phenomenon appeards while the display is OFF, not during normal use (obseved while logged in over ssh).

ONe can easily see the tracing getting busy by:

  1. logon via ssh seession
  2. devel-su to root
  3. find PID of systemd-logind
  4. execute strace

As soon as the display goes to sleep, the traces show up like in the logs. Pressing power key to wake up the device stops it again.

Thanks.

Any hints on how to effectively use dbus-monitor for a newbie?

Strange, it consumes some cpu even on my idle phone :slight_smile: (~3%, but it may be misleading, I’m not sure how fast cpu is running at this state).

To dbus-monitor, it is simple. As root, just execute:

dbus-monitor  --system

There is some activity from logind (path /org/freedesktop/login1 belong to logind)

signal time=1636672660.372447 sender=:1.6 -> destination=(null destination) serial=81804 path=/org/freedesktop/login1/session/c1; interface=org.freedesktop.DBus.Properties; member=PropertiesChanged
   string "org.freedesktop.login1.Session"
   array [
      dict entry(
         string "Active"
         variant             boolean true
      )
   ]
   array [
   ]
signal time=1636672660.377794 sender=:1.6 -> destination=(null destination) serial=81805 path=/org/freedesktop/login1/seat/seat0; interface=org.freedesktop.DBus.Properties; member=PropertiesChanged
   string "org.freedesktop.login1.Seat"
   array [
      dict entry(
         string "ActiveSession"
         variant             struct {
               string "c1"
               object path "/org/freedesktop/login1/session/c1"
            }
      )
   ]
   array [
   ]

But I am not sure what exactly these properties mean. My guess is that it is signaling if session is active and it is caused by short cpu sleeps…? Not sure without reading documentation / source code.

But I believe that this activity is not caused by another application, they are signals triggered by logind.

1 Like

Related bug report: Xperia X high battery consumption in Kvarken 4.1.0.24

I have installed htop recently, since top is no longer as useful as it used to be.
It shows systemd-logind is always the process with the most CPU time (usually twice lipstick, six times sensors.qcom and even the Sailtrix matrix client). Compare this to the desktop, where it is one of the least CPU time using programs!

are we sure that this is not caused by the cpu going to deep sleep and the usage only counts the time when it’s active?

If you look at this using strace you’ll see that at least the file I/O, if that is to blame, starts as soon as the display is turned off. So no I don’t think it’s a timing/measuring issue.

Although I’m not sure if a timing case wouldn’t look just like that.

Please consider to fill upstream bug, I don’t think that this issue is Jolla specific.

I would rather avoid dealing with upstream of this particular piece of software.

(Oh and should’t it be Jolla who file it? They are “my distro” in this scenario, and upstream bugs should be done through the “distro maintainer” usually.)

But if it’s unavoidable, any hints on how to gather proper logs from logind and udevd in order to be able to make a proper bug report there?

Sooo, doing a little more research:

logind reads lots of sound-and video related devices, and their uevent files. Looking at one of those, one notices:

 udevadm info -p /devices/platform/soc/soc:sound/sound/card0
P: /devices/platform/soc/soc:sound/sound/card0
E: DEVPATH=/devices/platform/soc/soc:sound/sound/card0
E: ID_FOR_SEAT=sound-platform-soc_sound
E: ID_PATH=platform-soc:sound
E: ID_PATH_TAG=platform-soc_sound
E: PLATFORM_DEVICE=soc:sound
E: PLATFORM_FOLDER=soc
E: PULSE_IGNORE=1
E: SOUND_FORM_FACTOR=internal
E: SOUND_INITIALIZED=1
E: SUBSYSTEM=sound
E: SYSTEMD_WANTS=sound.target
E: TAGS=:seat:systemd:
E: USEC_INITIALIZED=15434191
E: androidboot.bootdevice=c0c4000.sdhci

So, this is tagged as a “seat”, which means logind is reponsible for it, as: sd-login sais

… and further down:

which I guess is what’s happening, as at the end of one of those scanning runs, strace shows some of these:

setxattr("/dev/snd/hwC0D44", "system.posix_acl_access", "\2\0\0\0\1\0\6\0\377\377\377\377\2\0\6\0\240\206\1\0\4\0\6\0\377\377\377\377\20\0\6", 44, 0) = 0

Also, more info here which explains what and how happens here.

So this explains why udev and logind use CPU in concerto, and in principle all of that is expected behavior (except that this is a single-seat system all of that is kinda pointlessly overcomplicated, (like almost anything what comes out of freedesktop.org)).

(Sorry if you’re bored by this if it seems common knowledge to you. Myself I find it new, if annyong-to-get, knowledge.)

My TL;DR for now is, all those file accesses are cause by the set-ACL-if-user-becomes-inactive feature, and are therefore normal.

Which brings me back to the original topic: if this is NOT what is causing the load, what is?

5 Likes

Aaand another one:

Looking at udev straces this time, I see a lot of execve and related syscalls. Now, spawning external processes, that’s something we want to avoid. What could cause it?

A little grepping leads quickly to /lib/udev/rules.d/999-android-system.rules which is an autogenerated config file and is full of things like this:

#:/sys/devices/system/cpu/cpu*   cpufreq/scaling_min_freq   0664  system system
# sys rule
DEVPATH=="/devices/system/cpu/cpu*", TEST=="/sys/$devpath/cpufreq/scaling_min_freq", RUN+="/bin/chmod 0664 /sys/$devpath/cpufreq/scaling_min_freq", RUN+="/bin/chown system:system /sys/$devpath/cpufreq/scaling_min_freq"

so this spawns a chown and a chmod every time CPU device nodes change (which due to power saving is rather often).

QUESTION: to someone with udev knowledge:

Am I correct in assuming that a

DEVPATH=="/devices/system/cpu/cpu*", TEST=="/sys/$devpath/cpufreq/scaling_min_freq", MODE="0664", GROUP="system", OWNER="system"

does the same thing as the chown/chmod combination above?

1 Like

And now you know why all my server systems are sans systemd :slight_smile: Not to kick at that bucket, but one note on your comment before this one, this IS a multi-user system, though we want it to behave like a single seat, it isn’t.

Did you note the device node perms before and after sleep/wake? I don’t see a reason for the perms to change on wake/sleep.
Did you try commenting The rule out :wink: I haven’t looked at it, but would guess it’s superfluous. That’s what’d I’d try if I wasn’t so busy debugging QML :wink:

Well,

grep -c RUN+= 999*
999-aliendalvik.rules:0
999-android-system.rules:31

(EDIT: no, the following sentences are wrong. See the source code comments linked below.)

I have as a test replaced all the RUNs with corresponding OWNER, GROUP, MODE lines. Now many of those relate to cpuN paths, which appear and disappear as power saving turns the cores on and off.
So correcting/setting ownerships through udev is okay in this case I think.

Also, that RUN+="chown/chgrp" has been a best practice in past udev rule days, and that file is autogenerated by some droid-hal-* script from Android configuration.
I wonder if that script just uses Ye Olde Way because it has always done that, and the OWNER, GROUP, MODE would be better. If it is indeed equivalent.

Ok, I’m on a community device so it looks a bit different (21 matches in 999-android-system). I don’t think my naive approach will work, but I also don’t think it’s relevant. Even with the frequency, the cpu usage doesn’t make sense. BUT you said above that strace reveals it’s I/O that’s to blame.

I just did a quick and dirty check (4.3 on the volla) using the dbus-monitor --system approach and got tons of serial (comms/wifi connma and co., dhcp) activity which DOES seem a bit frequent for a phone that’s in sleep/idle. But I didn’t see anything related to sound?!

On the other hand, in idle:

  452     1 root     S    19208  0.4   1  0.0 /usr/lib/systemd/systemd-journald
 1364     1 root     S     347m  9.0   3  0.0 /usr/sbin/connmand -n -W nl80211 --nobacktrace --noplugin=wifi

… snip

 1096   622 mediaex  S     258g6916.5   4  0.0 {mediaextractor} media.extractor aextractor
 1136   622 mediacod S     258g6916.4   5  0.0 {mediaswcodec} media.swcodec oid.media.swcodec/bin/mediaswcodec

WTF? (ps, that journald produces so much load … ducks and runs).

But realistically, only lipstick is producing any load. I think this may be device dependant? And I’m running community, so…

Erg. What’s really disturbing is how much cpu Tidings eats in idle. Sigh. I have even more work to do.

EDIT, like 3. So, sitting here watching htop, lipstick and journald produce between 2-5% of cpu load with the phone in sleep (well, is it in sleep if I’m running htop, not really). Connman runs a steady 0.6 almost constantly.

Oh, it seems upstream knows about all the chown/chmods:

And this answers my question above, the owner/group/mode thing is not equivalent.

cool, but I’d guess that’s only a small part of the problem? Or I just see completely different problems. What device were you testing with?

Yeah, still not quite there what the actual problem is, all those device nodes might be the wrong thing to look at.

Xperia10 Dual-Sim