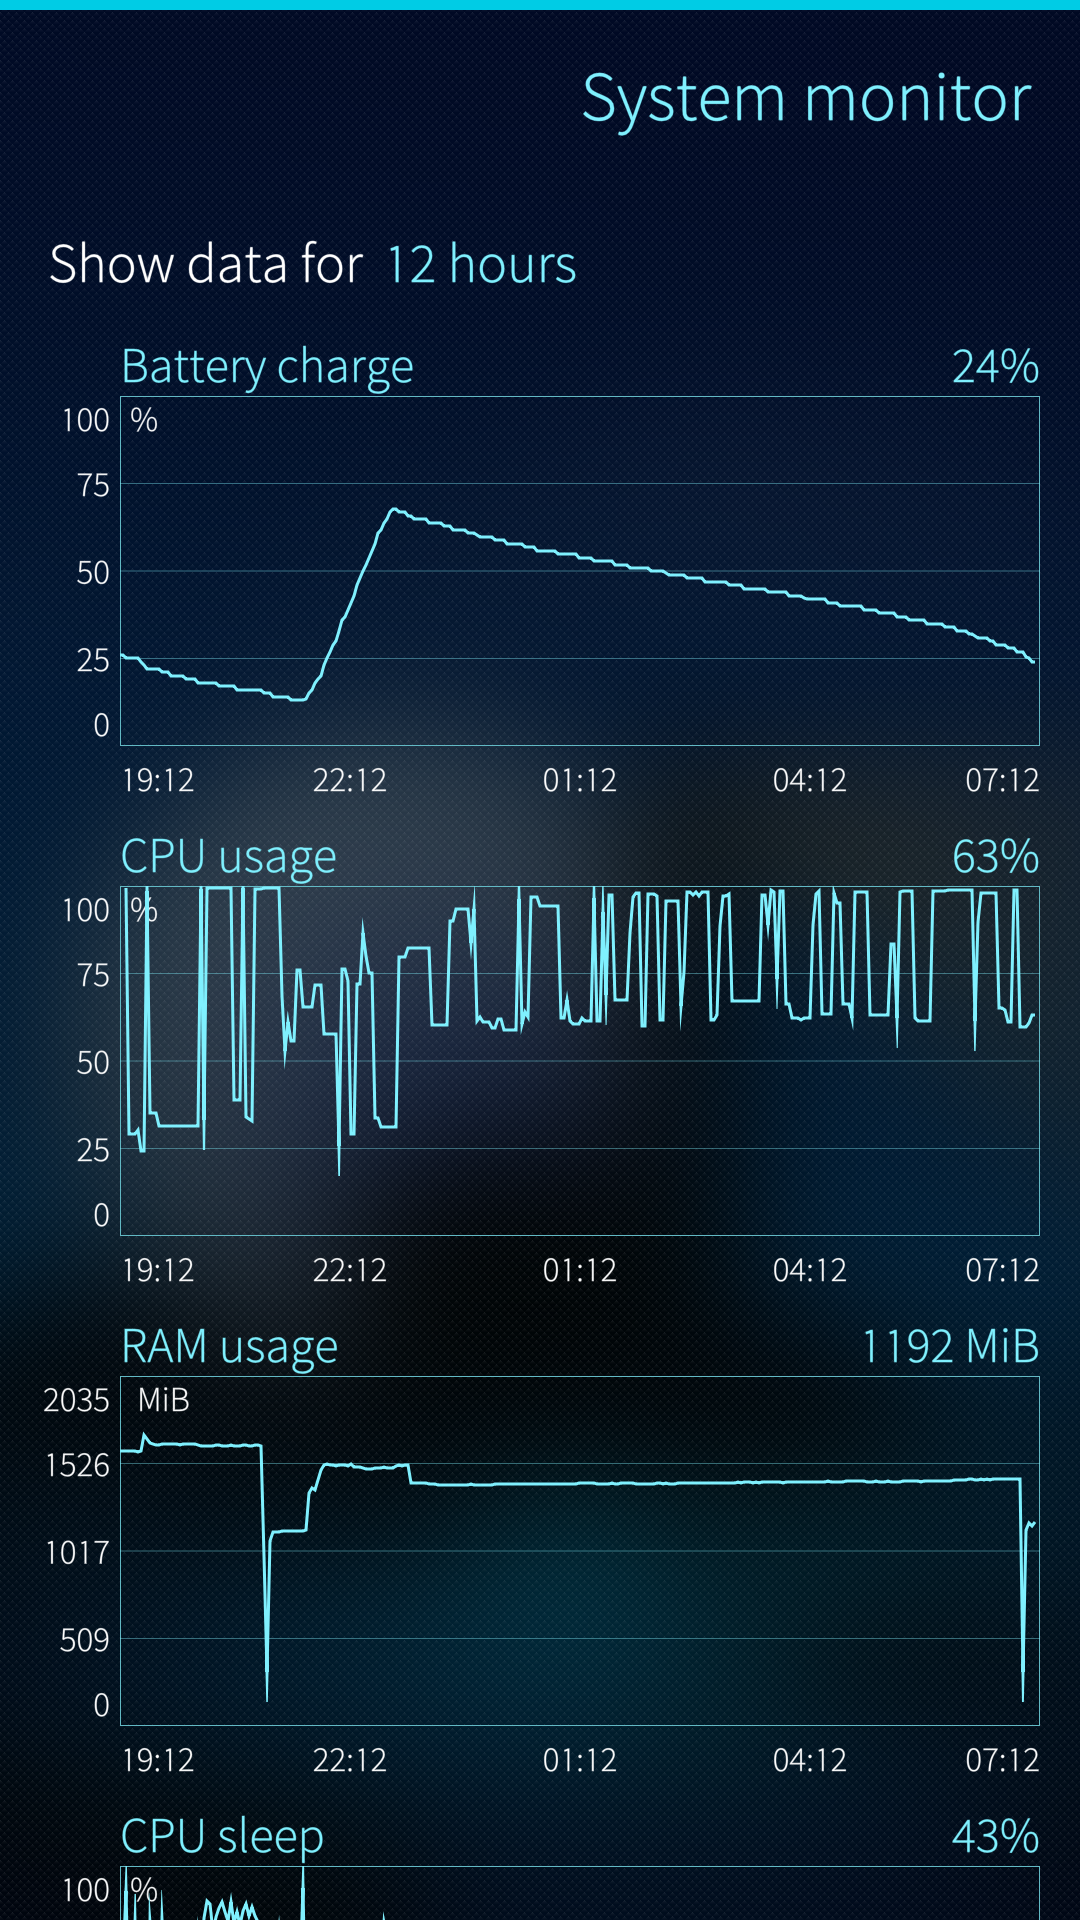
I have noticed that my phone (XA2 Single Sim running version 4.0.1) discharges extremely fast overnight. Last night (23:00 to 07:00) went from around 70% to 24%. I had already noticed this behaviour in the past. It began with the version 3.4.
The phone was all the night in Flight Mode and only two alarms were active. Only the clock app tile was present in the tile view. All the other apps were closed.
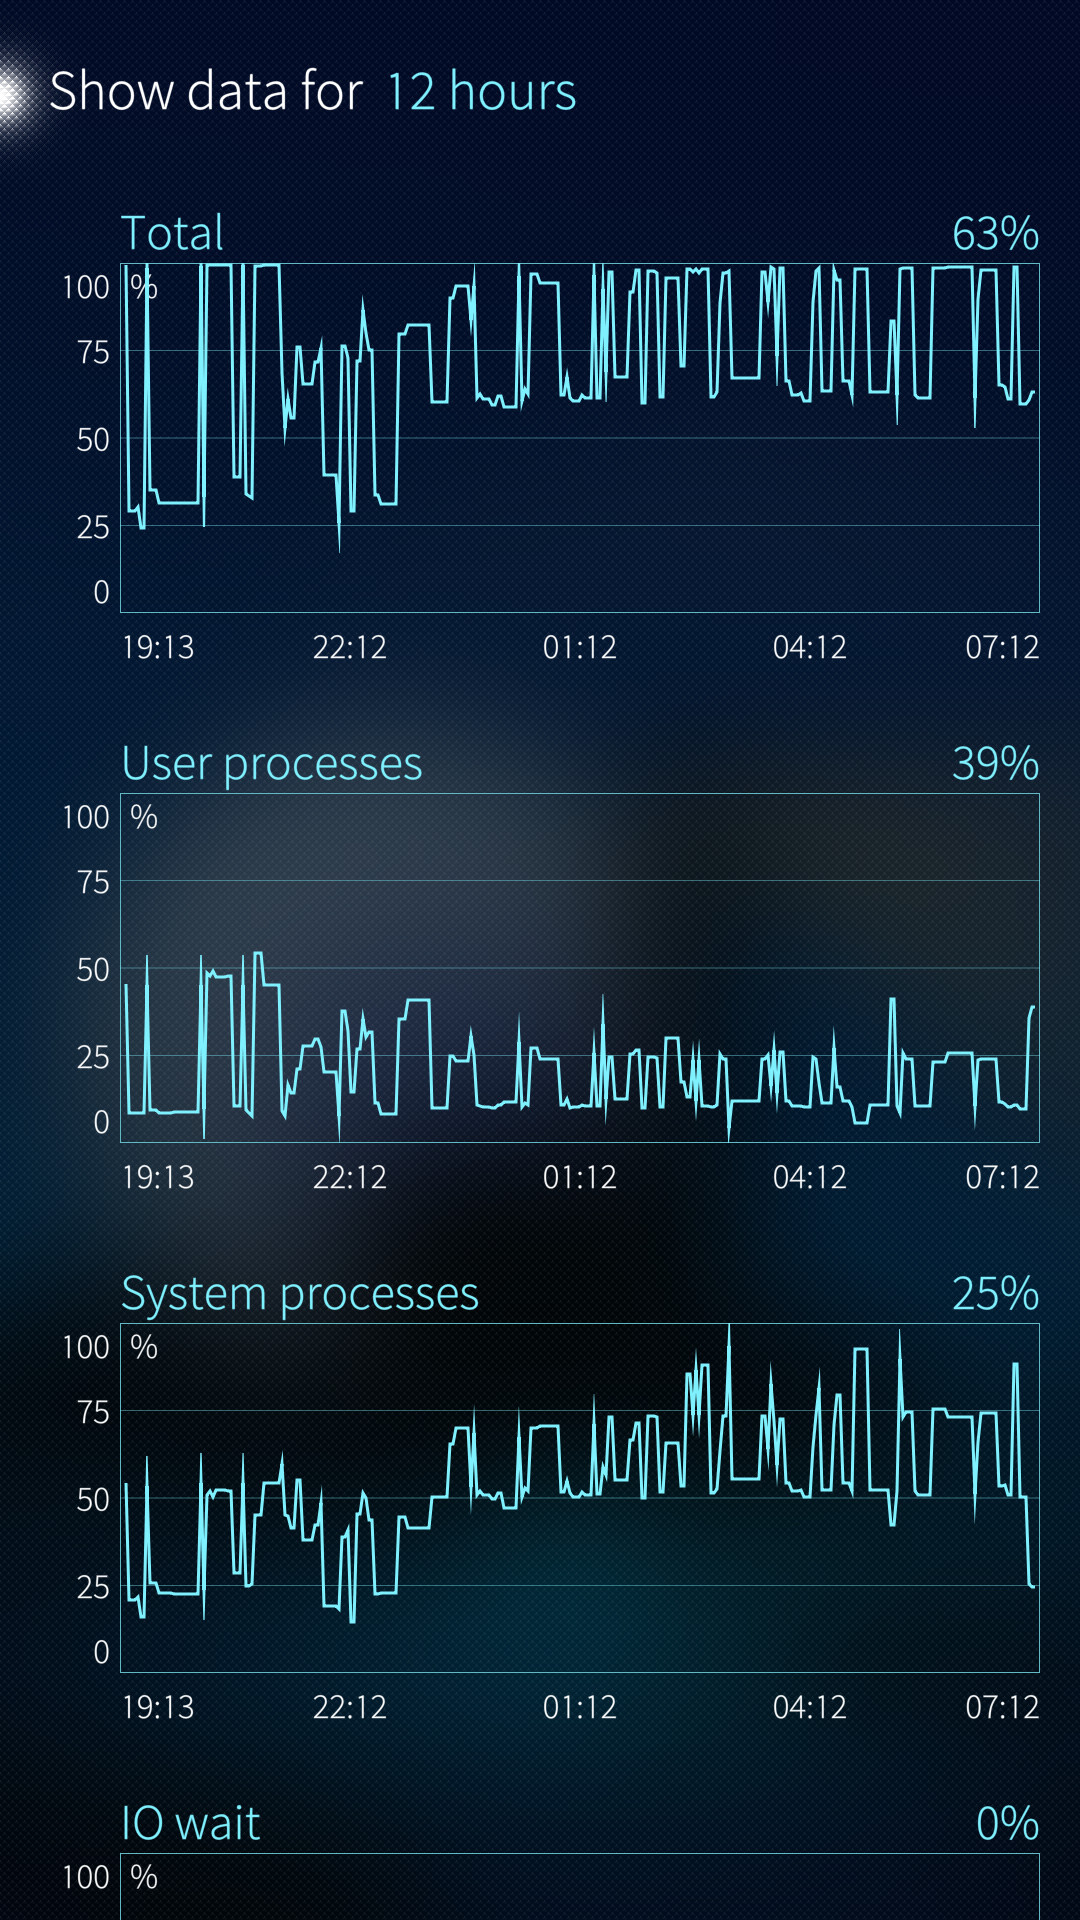
After some restarts, the battery consumption seems to go back to normal. So I suppose there has to be a process or application that after some time of operation or after some event begins draining the CPU (see screenshots). It appears that both system and user processes are pretty busy at night.
This morning I checked in top whether there was something actively monopolizing the CPU, but there was nothing unusual.
I have not installed anything new in the last months, or at least nothing that I am aware of that could be running in the background.
Here is my question. Since I am a linux beginner, I am unsure how to write a script or to issue a command which would help to monitor or log the CPU usage overnight. At least to known which processes are active draining the battery.
Is there any specific command or app that could help?
Thanks a lot!
Edit: The SysMon app monitors each 2 minutes. But I do not think this would justify such battery drain as the SysMon app also runs in the background when the battery behaves normally after said restarts.
Regarding your original issue: I had some issues with 3.4 myself, where Android apps would run with high CPU load in the background, for me but these issues disappeared with 4.0…
Do you use Android Support? I encountered a similar phenomenon and it turned out that the processes d.process.media and sdcard (as seen with top in the terminal) caused the battery drain, see this thread
Thanks for the recommendation, I will try it later.
However, am I wrong or SystemDataScope is similar to SysMon and only logs/displays the status of the CPU/Battery (among others), without logging which specific process was using a specific amount of CPU at a specific time?
SystemDataScope can log data while the app is not running. It’s basically a frontend for the linux datalogger “collectd”.
To do so go to settings and enable the first two checkboxes (and the third if you want to start loggin at bootup)
Indeed, collectd will log overall stats. Not sure whether newer collectd would allow you to split stats between apps. I would have to update SDS and collectd to 4.0 new requirements (loss of statefs) and graph generation script to python3. Was not needed before, now it is time, it seems.
As for original issue, follow also CPU sleep. On phone, it is important to keep it sleeping to avoid battery drain. Although, case as yours, seems to be extreme.
The script can do something like this: monitor-processes.sh (note that this assumes non-busybox bash and ps)
#!/usr/bin/env bash

HOSTNAME="${COLLECTD_HOSTNAME:-localhost}"
INTERVAL="${COLLECTD_INTERVAL:-5}" # collectd will set this in its environment, 5 secs default only for calling manually

# suspect process names here:
processes="lipstick connmand sensorfwd msyncd sensors.qcom voicecall-ui"
gaugevalues="cpu mem"
absvalues="rss vsize"

  for p in $processes; do
    for v in $gaugevalues; do
       VALUE=$(ps --no-headers -p $(/sbin/pidof ${p}) -o %${v} 2>/dev/null || echo "U")
       LANG=C echo "PUTVAL \"$HOSTNAME/single-process/gauge-${p}_${v}\" interval=$INTERVAL N:$(echo $VALUE)"
    done
    for v in $absvalues; do
       VALUE=$(ps --no-headers -p $(/sbin/pidof ${p}) -o ${v} 2>/dev/null || echo 0)
       LANG=C echo "PUTVAL \"$HOSTNAME/single-process/absolute-${p}_${v}\" interval=$INTERVAL N:$(echo $VALUE)"
    done
  done
Now, this will just collect the data, It’s a bit more involved to then have that data graphed by the application. Haven’t done that part
I have just released collectd and SystemDataScope which should work now on SFOS 4.0.1. If you want to follow some specific processes, take a look into Plugin processes. Default config (/etc/collectd.conf) has examples on how to enable monitoring some processes. You would have to enable plugin (uncomment corresponding LoadPlugin in the top of config), uncomment and specify your processes in plugin config (section as shown below)
<Plugin processes>
 	Process "collectd"
 	Process "rrdtool"
 	Process "systemdatascope"
 	Process "sensorfwd"
	Process "sensors.qcom"
</Plugin>
and restart collectd. After running for some time, just regenerate graphs in SystemDataScope settings. Plotting processes stats is supported already (if it is broken, please open an issue).
This may sound silly, but if you can catch your device while it’s discharging rapidly then here is something else you could check.
Try logging the discharge rate while you toggle flightmode on and off a couple of times. Say at five-minute intervals.
I have seen power consumption rise sharply in flightmode, then fall back when I enable radios again. Once this has happened, it would keep doing it until next reboot. Never saw it immediately following a reboot, so my workaround is to avoid flightmode or to reboot after I enable it…
(I never could nail which process was the culprit, but I strongly suspect Email or CalDAV sync. Some race condition or incorrectly handled network error maybe.)
Just a hint for those that try moitoring processes: it appears the “Process” directive does not pick up those processes (I suspect) whose names appear multiple times in the process list. This affects e.g. GUI apps which are launched through sailfish-qml or invoker.