With the Sailfish SDK 3.7.4 installed I ran into the following issue many-many times:
QML live bench runs, the target looks online, however the debugger stuck at this point:
Any suggestions how to overcome this, or what else shall I be looking for?
With the Sailfish SDK 3.7.4 installed I ran into the following issue many-many times:
QML live bench runs, the target looks online, however the debugger stuck at this point:
Any suggestions how to overcome this, or what else shall I be looking for?
I’d try to explicitly (re)connect by clicking the “Offline/Online” button in the bench.
Does it only happen when debugger is used at the same time?
Could you please tcpdump the communication between bench and host?
tcpdump -w qmllive.pcap --print host 192.168.2.16 and port 10234
QMLLiveBench is quite fickle at times. Sometimes it starts right away without clicking Online/Offline, other times it is waiting for me to click Online/Offline. As per instruction from @martyone, I try to start LiveBench before compiling.
If I neglect to start LiveBench before compiling, the entire frame of SDK window starts flashing/pulsing which means I cannot open the Tools menu to select LiveBench. The SDK window flashes around 8 times before allowing the Tools menu to be clicked on.
Silly question time @martyone: Where is the terminal in SDK?, how do I open it, where do I find it?, apologies, I’ve asked this before somewhere and do not recall the answer I was given.
Hm that sounds really weird. Which platform are you on?
Please try to collect very detailed steps to reproduce, starting with SDK completely off.
Regarding your question about terminal, if you mean a terminal to enter build commands (qmake, make, gcc…), then you are looking for the sfdk command line tool, which lives in the bin subdirectory of Sailfish SDK installation directory. Build commands can be executed with the help of sfdk build-shell command. Start by reading sfdk --help. On macOS you should ensure you are using modern BASH, on Windows it is recommended to use sfdk under MSYS2.
Thanks @martyone. I’m running Windows 7 Ultimate.
Yes, I meant terminal to enter build commands, thanks for the reminder, much appreciated.
I will try to find the time to reproduce the problem. I have reported as such before, I recall you suggested that I start LiveBench before compiling.
It would be great if you could link that, I couldn’t found any notes on that quickly. I am afraid Window 7 is not going to receive any support, but I will definitely try to reproduce and possibly fix on Windows 10 when you have collected the detailed steps.
Yes Sir!
Please see the log here:
https://www.dropbox.com/s/zglyhlzoqkbl603/qmllive.pcap?dl=0
The debugger stucks here:
I have tried to toggle the Offline-Online several times, but it did not helped.
For reference the command I used:
I saw that the platform was mentioned above: I am running it under Ubuntu 20.04 with the latest released SDK.
sudo tcpdump -i usb0 -w qmllive.pcap host 192.168.2.16 and port 10234
I cannot find the original link to my original report you’ve quoted…perhaps another Sailor responded, I can’t be sure.
However, I have recently upgraded my PC to Windows 10 x64bit Pro and a completely new install of Sailfish SDK latest.
Things in general are much better, I also increased resources in VirtualBox, the SDK starts and seems to run a bit quicker now.
However, purposely leaving the start up of QmlLiveBench until last, exhibits the behaviour I originally encountered, but less random, sometimes QmlLiveBench starts/opens correctly and all is usable. But, other times…the following;
wait for pop up dialog;
"QmlLiveBench is not running. Do you want to start it now?
Learn more on using QmlLive with Sailfish OS device"
[YES] [NO]
click [YES]
the blue waiting spinner appears by cursor, which blinks on and off at least 7 times, while this is happening, if I try to click on the Tools menu, the menu disappears…it is not accessible until the waiting spinner has finished, then I have to go to ‘Tools’ again, ‘Sailfish OS’ and ‘Start Qmllive Bench’…then it opens and my app shows on my device and all is running as it should.
Under Windows 7 previously, the entire SDK window frame would flash/pulse, notably with Windows 10 only the blue waiting spinner flashes. Not a big problem, slightly irritating, but then…I am easily irritated.
All in all, SDK feels a lot more fluid as does my PC in general. I also noted that my original Windows 7 install was from 2014!!
Have you had a chance to look at my trace?
Now I am 100%ly unable to launch debugging with QML updates enabled.
Apologies for not replying earlier - busy times. I see there is one message missing which the device should send right at the beginning of the communication, but I do not see how it could happen WRT the current implementation.
Could you please try adding QT_LOGGING_RULES=qmllive-sailfish.preload.debug=true to Projects > Run Settings > Environment, run you application with that and paste the output of the Application Output pane? (If you do that correctly, you should see a message like [D] unknown:0 - Initializing with view QQuickView(0x5fa51d63d0) [[ in the output.)
Nah I deleted my last post because I realized after posting that the host was offline when the log was copied.
Now it got stuck with online host and have the following output:
18:43:49: Checking available ports...
18:43:49: Found 101 free ports.
18:43:49: Starting gdbserver --multi --once :10002...
18:43:49: Waiting for gdbserver...
18:43:49: Debugging /opt/sdk/sailfish-ble-rc/usr/bin/sailfish-ble-rc -qmljsdebugger=port:10003,block,services:DebugMessages,QmlDebugger,V8Debugger,QmlInspector,DebugTranslation ...
Listening on port 10002
Remote debugging from host 192.168.2.2
limiting remote suggested packet size (18431 bytes) to 16384
Process /opt/sdk/sailfish-ble-rc/usr/bin/sailfish-ble-rc created; pid = 29141
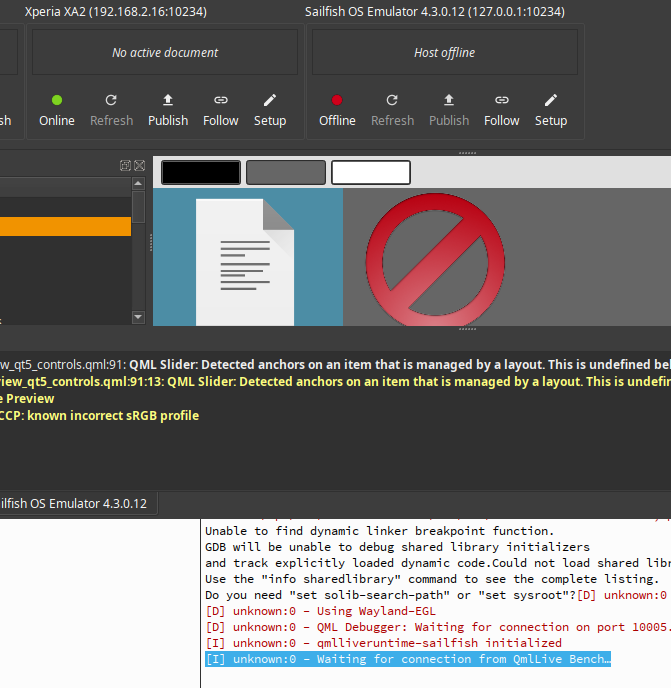
Unable to find dynamic linker breakpoint function.
GDB will be unable to debug shared library initializers
and track explicitly loaded dynamic code.Could not load shared library symbols for 49 libraries, e.g. /usr/lib/qmllive-sailfish/libsailfishapp-preload.so.
Use the "info sharedlibrary" command to see the complete listing.
Do you need "set solib-search-path" or "set sysroot"?[D] unknown:0 - QML debugging is enabled. Only use this in a safe environment.
[D] unknown:0 - Using Wayland-EGL
[D] unknown:0 - QML Debugger: Waiting for connection on port 10003...
[D] unknown:0 - Initializing with view QQuickView(0x5124b0) [[
[D] unknown:0 - ipcPort: 10234
[D] unknown:0 - workspace: "/opt/sdk/sailfish-ble-rc/usr/share/sailfish-ble-rc"
[D] unknown:0 - workspaceOptions: QFlags<LiveNodeEngine::WorkspaceOptions>(AllowUpdates|UpdatesAsOverlay)
[D] unknown:0 - connectionOptions: QFlags<RemoteReceiver::ConnectionOptions>(UpdateDocumentsOnConnect|BlockingConnect) ]]
[D] unknown:0 - ]]
[I] unknown:0 - qmlliveruntime-sailfish initialized
[I] unknown:0 - Waiting for connection from QmlLive Bench…
Toggling the online/offline did not helped this time.
And I have not managed to get it passing this step since then. (I tried at least 10 times)
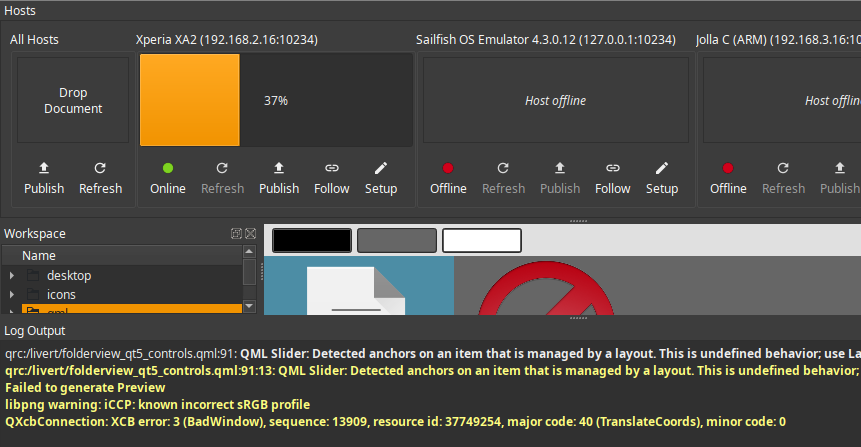
Some further info: if I click on publish in the QML Livebench window it goes up to 37% and then it stuck:
But in the QtCreator nothing happens.
Would a tcpdump from this publish process be helpful?
Hm, from the log I noticed you are using the “Deploy by Copying Binaries” deployment method, so I tried with that and I immediately hit your error! And it persisted even after I switched back to “Deploy As RPM Package” method, but restart of Qt Creator fixed it and I haven’t been able to reproduce it again no matter what I tried :\
Would a tcpdump from this publish process be helpful?
Hard to say, let’s try.