The issue that @flypig is now trying to figure out sounds a bit like the one I had with Qt Scene Graph recently. I wasn’t properly releasing textures so it kept reserving dmabuf file descriptors and then eventually the app crashed because it run out of fds (or rather I think it tried to use fd > 1024 for something that’s not compatible with such “high” value). Anyway lsof -p output might be worth looking at.
I’m just going to quote @flypig since it’s good to get some inspiration on a slog:
For those who are still following along, or just desperate to get your hands on a build to test, I appreciate it’s slow progress. But each fix is a fix that’s necessary and I remain confident that eventually all of the pieces will fall in to place. This is very definitely a marathon and not a sprint. An Odyssey not a citybreak. We’ll get there!
Rabbitholes be like loooooooooooooooooooong ones, right?
Indeed! In my case, keeping me from doing sailfish work! Oh, no!
Seems @flypig finally managed to escape from a particularly deep one. Good to hear you fixed the freezing issue!
Sheesh, was a bit of a read to catch up! And all for the difference in EGL and Egl 
@flypig i suggest giving the LIB_GLDEBUG
/ MESA_DEBUG a try. They will generate alot of output but might highlight the failing function right away. Its time for the heavy weapons 
Thinking about debugging GL code, maybe @flypig, you know or already uses this:
    glEnable(GL_DEBUG_OUTPUT);
    glDebugMessageCallback(_openGLMessage, 0);
where you can provide a function dealing with GL errors:
static void _openGLMessage(GLenum source _U_, GLenum type, GLuint id, GLenum severity,
                           GLsizei length _U_, const GLchar* message,
                           const void* userParam _U_)
{
  gboolean warn = TRUE;
  const char *ctype, *cseverity;
  switch (severity)
    {
    case GL_DEBUG_SEVERITY_LOW:
      cseverity = "LOW";
      break;
    case GL_DEBUG_SEVERITY_MEDIUM:
      cseverity = "MEDIUM";
      break;
    case GL_DEBUG_SEVERITY_HIGH:
      cseverity = "HIGH";
      break;
    default:
      cseverity = "UNKNOWN";
    }
  switch (type)
    {
    case GL_DEBUG_TYPE_ERROR:
      ctype = "ERROR";
      break;
    case GL_DEBUG_TYPE_DEPRECATED_BEHAVIOR:
      ctype = "DEPRECATION";
      break;
    case GL_DEBUG_TYPE_UNDEFINED_BEHAVIOR:
      ctype = "UNDEFINED";
      break;
    case GL_DEBUG_TYPE_PORTABILITY:
      ctype = "PORTABILITY";
      break;
    default:
      ctype = "OTHER";
      warn = FALSE;
    }
  if (warn)
    g_warning("GL CALLBACK: type = %s, severity = %s, id = %d, message = %s",
              ctype, cseverity, id, message);
  else
    g_debug("Visu OpenGL: type = %s, severity = %s, id = %d, message = %s",
            ctype, cseverity, id, message);
}
I’ve used it to partly understand what was wrong in my GL code. But maybe it’s not appropriated in your case if it’s a transfer issue between GPU and offscreen buffer… Good luck anyway !
If its an opengl transfer, it will show!
@flypigg about the misalligned texture;
two things can go wrong (assuming the data is correct in the texture) :
- alignment of data (start, stride)
- format of pixel (ARGB / RGBA etc)
Which one is the texture you are looking at configured with?
Is the image the same the browser would show? Which image are you displaying in the embedded view?
Just some small ideas, hth 
Thanks for the input @tortoisedoc. I know what sort of image I’m asking for (RGBA in UNSIGNED_BYTE format). But whether that’s what’s being produced is less clear. Based on the code I expected it to be in the same format as is rendered to the screen, but that doesn’t seem to be the case after all 
See where the glTexImage2d is used ?
https://registry.khronos.org/OpenGL-Refpages/es3.0/html/glTexImage2D.xhtml
that should give you an idea where the data comes from, maybe
@flypig can you post one of the texture files? when i was working on my libcamera app, I found a website that let you upload a raw image, enter the width/height and try different parameters until you got it to display correctly. Right now I cant remember what it was though, but i’ll keep looking!
Basic image editors, i.e. gimp, can also open anything. I have used it succesfully in similar situations.
@flypig some more thoughts on the alignment / stride etc:
assuming the rendering logic being the same in both off-screen and on-screen;
the difference can be in the shaders used; ie the vertex format…
and Id believe the same image / website would render ok on the on-screen pipeline…
so perhaps comparing the initialization of the rendering pipelines might give some insights…no idea how easy that is on firefox tho…
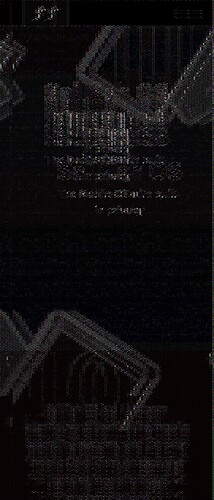
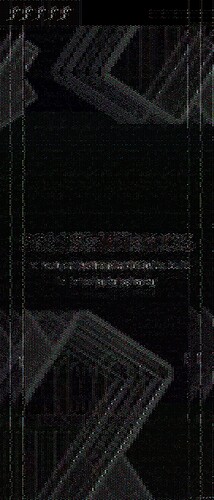
@flypig looking at the shape of the texture in the forelast post;
could it be the background element of the sfos website:
Thanks all for the input (and sorry for not replying sooner; I was travelling last week).
@tortoisedoc, you’re right, and well spotted, it should definitely be something to do with the sailfishos.org site as this was the site I was attempting to render. But how it fits in to it I’m not too sure I’m afraid.
@piggz, @vige, I’ve tried running the textures through GIMP’s raw importer, but with only the results you can see in my diary entries, so not very successfully unfortunately.
If any of you have the time, I’d love it if you can get better results. This archive contains a collection of the original raw files:
https://www.flypig.co.uk/dnload/dnload/sailfishos/gecko/gecko-frames-01.zip
The originals are all, in theory, 1080 x 2520 pixels in size and either RGBA (the first set) or RGB (the second set). But this may not be what they are in practice.
I thought it might be an offset issue, but after tooling about in gimp, I’m not so sure. What ‘should’ they look like 
The RGB data does seem to be RBG, the RGBA, I’m notsure. You said unsigned?
using imagemagick on the RGBA frames I get something like this using:
convert -size 1080x2520 -depth 16 -define quantum:format=usigned gray:frame050.data -auto-level result.png
Which probably needs an offset to get there but bits of sailfish logo can also be recognized. It does look unsigned judging from the results of the convert operation.
@flypig okay that’s something;
so the next piece of the puzzle: if you access sailfishos.org from the normal browser, does it render OK?
If so, it might mean the setup of the opengl context is wrong on the embedded side → comparing context setup data & capabilities between the two (browser and embedded (embedlite?)) would be the first I’d do. Only after confirming these as being identical would I jump in the brute-force deep pool as a measure of last resort 


