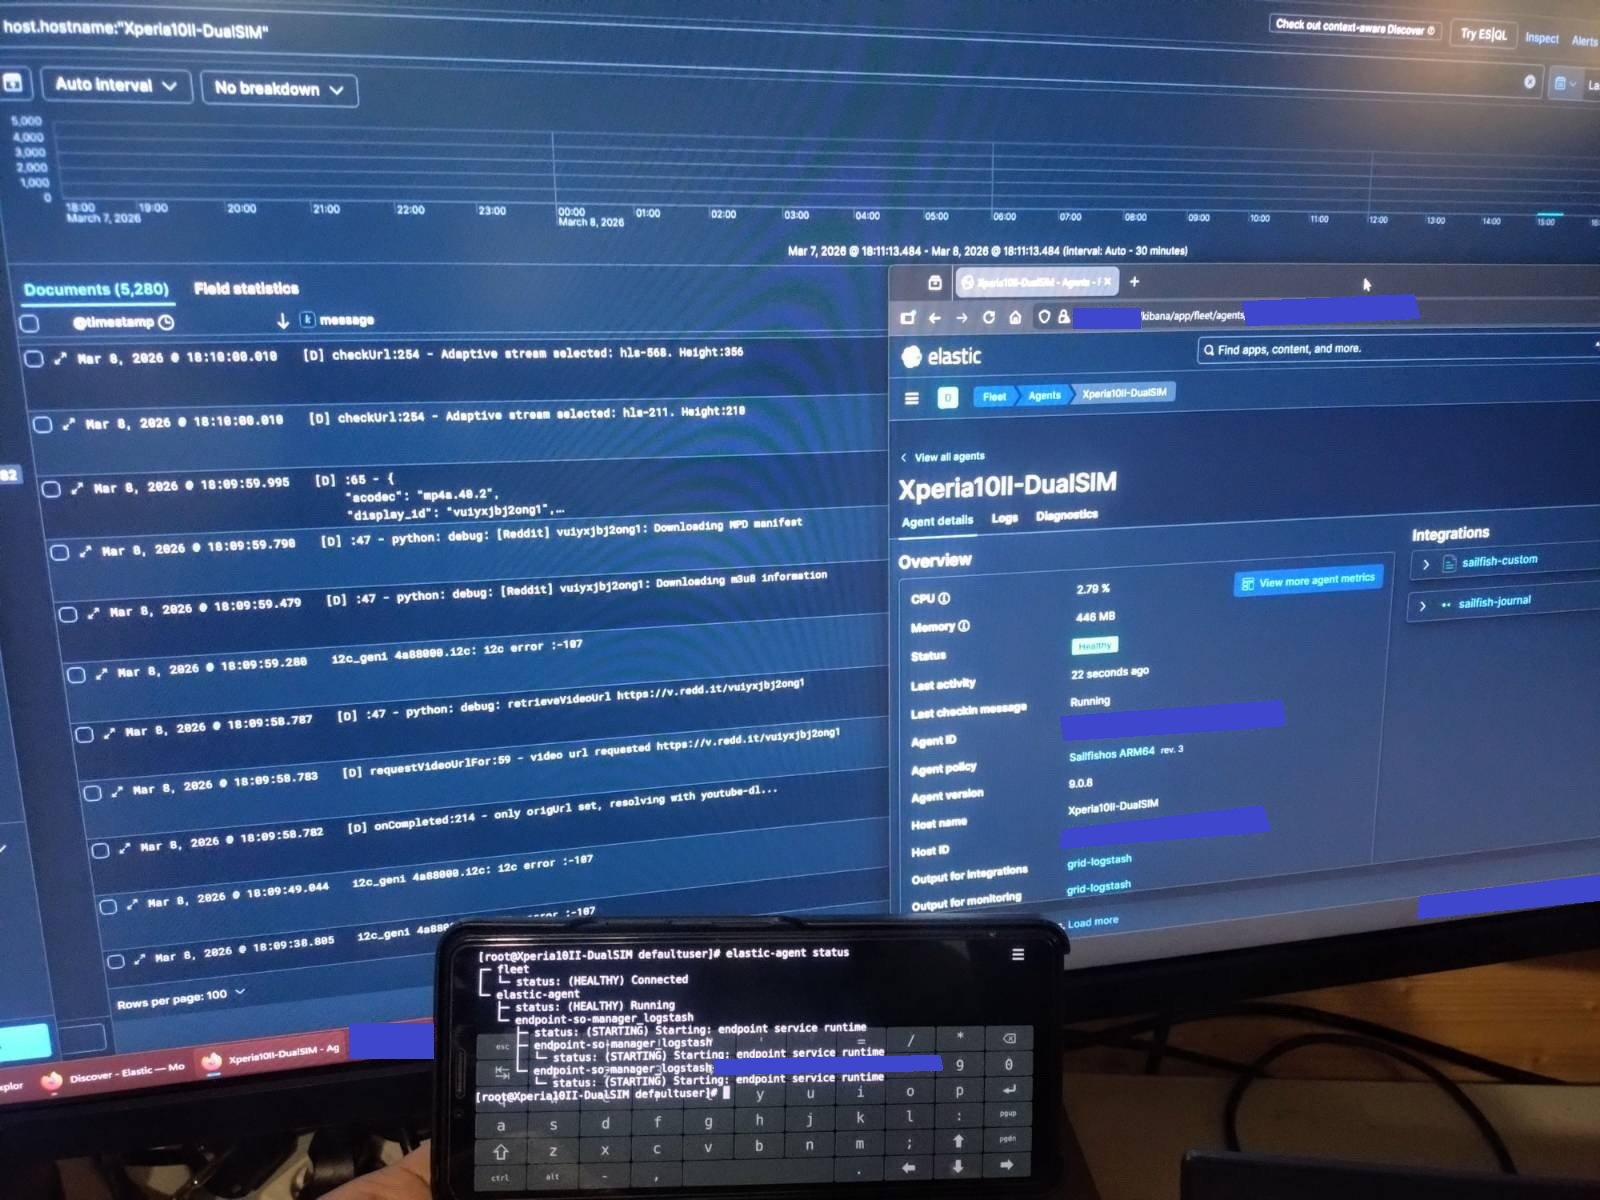
Picture 1: Event logs from phone to SIEM system.
INTRODUCTION
I recently installed security onion (a SIEM system) to an old PC and had an idea to try if I could get my old xperia 10II with sailfishos to log “everything” to external log server/SIEM system. I don’t know if if this is usable in the long term or how much battery it drains. This was just a test to see if I get it working without any further “real” plans, at least now. I thought just to report here if someone else wants to play with this more or fine tune it more.
Some quick terminology for those not familiar to the subject (AI used only for this list):
- SIEM - Security Information/Incident and Event Management
- Security Onion - Security Onion is an all-in-one platform for network security monitoring, intrusion detection, and threat hunting. Elastic stack is a part of the setup.
- Log agent - A small tool installed to an endpoint (usually computer) to send security (and other) events to centralized log server
- Elastic stack - Elastic Stack (formerly ELK Stack) is a set of tools used to collect, search, analyze, and visualize large volumes of data in real time.
- Elastic fleet - a centralized system used to manage and configure many agents from one place.
- Elastic agent policy - a configuration template that defines what data an agent collects and how it behaves.
- Elastic integration - a prebuilt package that tells the agent how to collect data from a specific service (for example your phone’s event logs)
SECURITY ONION INSTALLATION IN BRIEF
Security Onion (later SO) itself is pretty straightforward to install, just make a bootable USB-stick from the ISO, boot from it, answer some general questions (hostname, interfaces, addresses etc.) and let it do it’s magic. My old PC took about an hour to complete. At the end you have a full network monitoring solution at your disposal.
You can get SO from securityonion/DOWNLOAD_AND_VERIFY_ISO.md at 2.4/main · Security-Onion-Solutions/securityonion · GitHub
ELASTIC AGENT INSTALLATION
SO itself does not support ARM64-based log agents but as it uses elastic and elastic itself provides ARM64 agent, it was not very hard to get it working. I’m not sure if everything below is needed but just in case, below is what I did. Also note, that your phone and SO server of course must be on the same network, in my case WiFi.
- Download elastic agent ARM64 installer from elastic. Check the version of the elastic in SO (which lags from the latest elastic releases) and select the downloadable file according that. The versions must match. The version I used was here: Download Elastic Agent 9.0.8 | Elastic.co
- Move & extract the contents of the downloaded tar.gz into your phone.
- To install and enroll elastic agent more securely, you need a certificate from your SO server. Move the file /opt/Elastic/SO/soca.crt from your SO server to your phone. Installation can be done with - - insecure flag to skip certificate use (not recommeded for production use).
- With management PC browser, go to your SO servers web address > Elastic Fleet > Add agent > select endpoints-initial in create new agent policy field > scroll down until you see different operating system options.
- copy the last command row of the linux tar -installer, for example sudo ./elastic-agent install --url=https://REDACTED:8220 --enrollment-token=REDACTED
- Combine the steps 3 and 4 and you get a command something like ./elastic-agent install --url=https://REDACTED:8220 --enrollment-token=REDACTED --certificate-authorities=/home/username/soca.crt -v (the -v is just for more verbose logging)
- Go to the folder where you extracted the elastic agent and run the step 5 command with root privileges on your phone.
- Go back to SO web-GUI and you should now see your phone on the fleet agents now. By default the phone will be with endpoints-initial agent policy.
ELASTIC AGENT FINE TUNING
- In the web-GUI > fleet > agent policies > create agent policy > give it a name (Sailfishos ARM64 in my example) > remove check mark from “collect system logs and metrics” > Create agent policy
- Select you agent policy > press add integration > search for Custom Journald logs and select it > press “add custom journald logs”
- Give your integration a name (sailfish-journal in my example) > press save and continue > close the popup
- Agent is not limited to journal only. You can make another integration to follow almost any files or folders in your phone. In my case, I created with type Custom Logs (Filestream) and made it look for any *.log file from /var/log-folder.
- Now you got agent installed to your phone, agent policy created for it and integrations (~jobs) to do.
- Now you just have to move your phone from the endpoints-initial policy to your own. This is done by selecting your phone from the fleet > actions > assign to new policy > select your policy and you’re done
- Go to elastic front page from the three bars > (analytics) discover > search for your phone with name (example: host.hostname:“Xperia10ii-DualSIM”). You can now observe all the log events from you phone and even follow security alerts through SO’s alert view.
SOME LAST WORDS
Full SO and elastic usage takes some time to learn, but there are plenty of resources in the Internet for that.
I did play with this a little and was able to cause security alerts for example by scanning my phone with nmap or making multiple failed login attempts with SSH. Basicly this means that you could monitor your phone and get security alerts when something strange is happening or you could use it to just debug problems more easily.
What is still needed is to build VPN-tunnel between your server and your phone to use this also outside of home network.
Have fun!