I have a case where the app will crash when deployed from the SDK. The app, however, runs and if run from the terminal one can see what does and does not work.
Is there a way to attach the debugger in the SDK to running process on the phone?
I have a case where the app will crash when deployed from the SDK. The app, however, runs and if run from the terminal one can see what does and does not work.
Is there a way to attach the debugger in the SDK to running process on the phone?
For C++ debugging, you will need to disable the security feature that prevents the debugger attaching to unrelated processes. Run this on the device:
echo 0 |sudo tee /proc/sys/kernel/yama/ptrace_scope
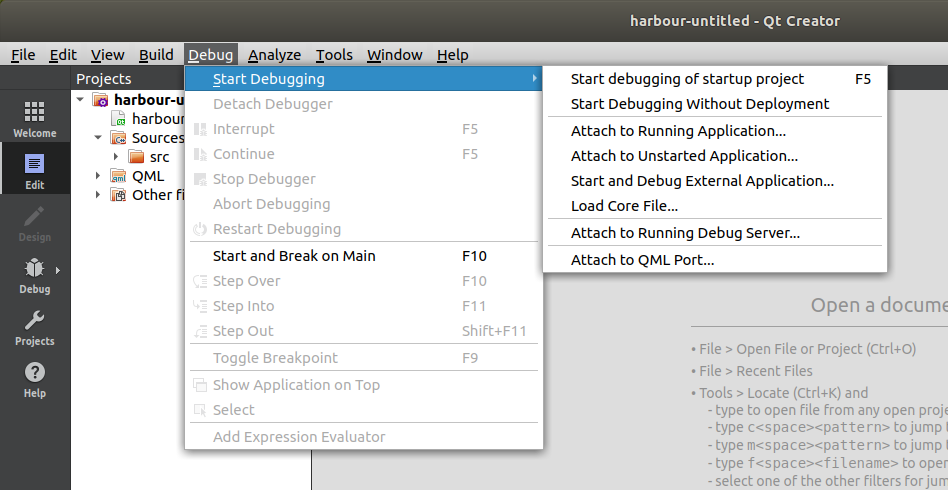
After that you can attach to a running process with Debug → Start Debugging → Attach to Running Application… under Sailfish IDE. Choose the kit corresponding to your device and give it a bit of time to populate the list of processes (there is no feedback while the list is loading).
For QML debugging, the application needs to be
-qmljsdebugger option to actually enable QML debugging at run time (e.g. -qmljsdebugger=port:10001,block,services:DebugMessages,QmlDebugger,V8Debugger,QmlInspector,DebugTranslation)After that, you can attach QML debugger under the IDE with Debug → Start Debugging → Attach to QML Port… . Choose the kit corresponding to your device and port passed to the -qmljsdebugger option.
(Yes, it is possible to attach both C++ and QML debuggers under the IDE at the same time.)
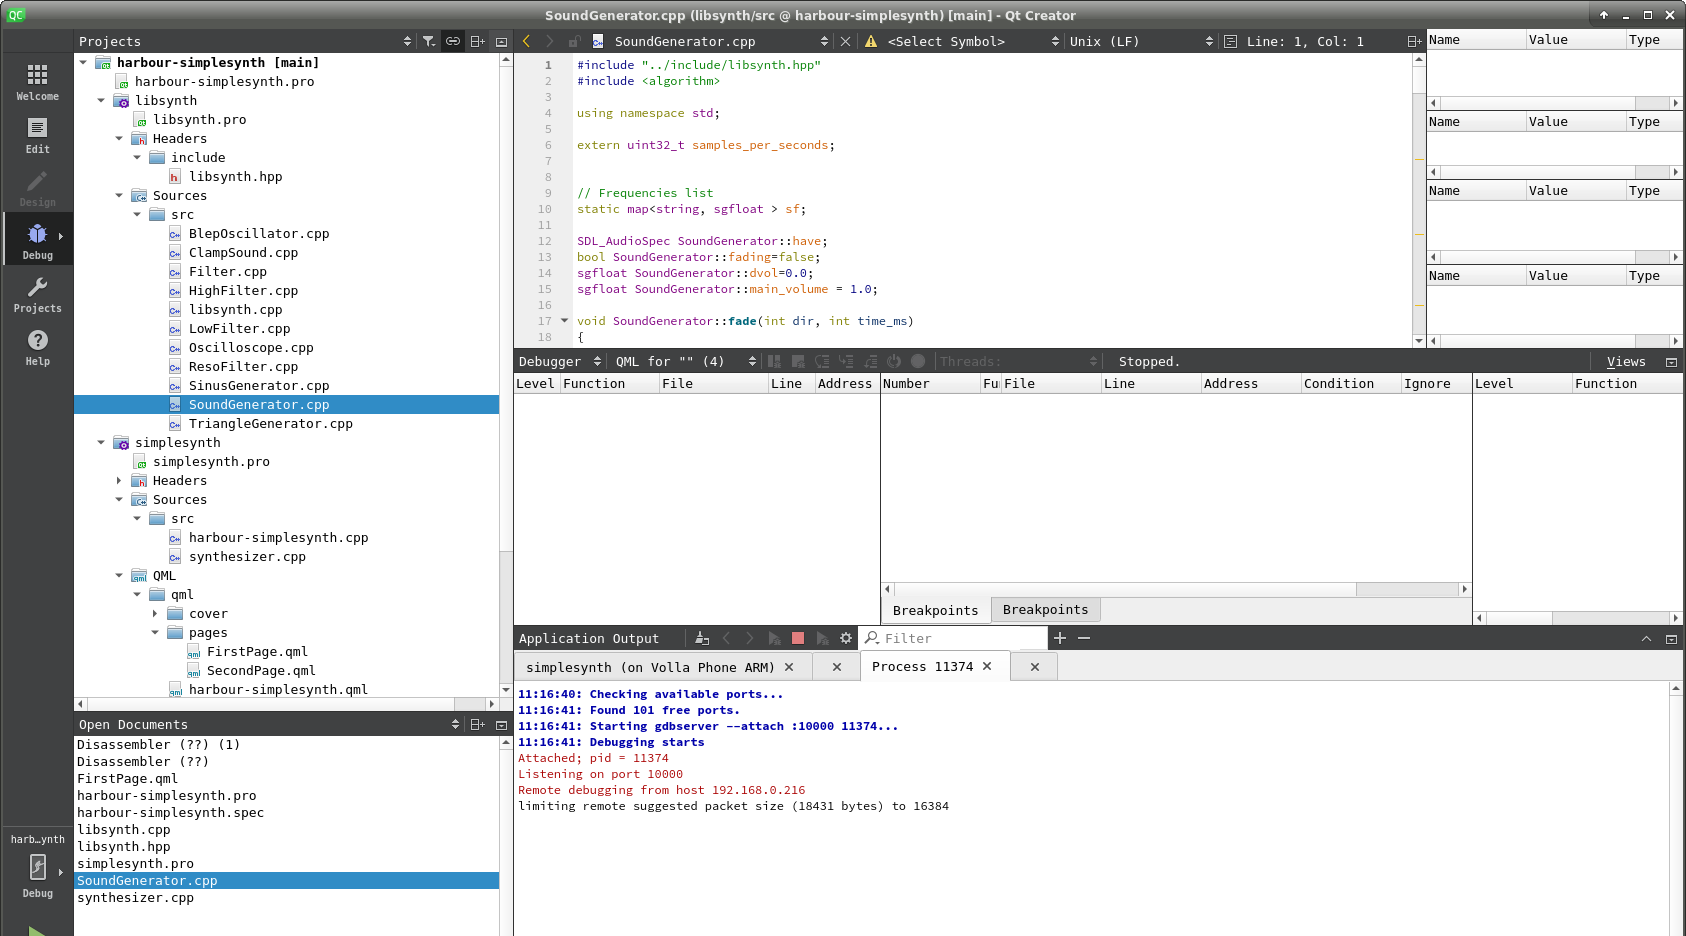
Where do I find that? With the Debugger selected, in a middle pain I see ‘Start debugging of Startup project’ bu no ‘Attach option anywhere’?
The help pages in the SDK say exactly what you describe, but I cannot for the life of me find a Menu with Attach in it.
The tip witth permissions is very helpful!
UPDATE. Still couldn’t find the menu, but I found the Env. setting for keyboard shortcuts and set one. This works!
Where could the menu be?
I don’t have this menu. It looks like the main application menus are not ‘on’.
I’m not sure how I would have created this situation.
Looks like attaching QML works too, but QML live not?
That’s interesting. Which OS / window manager are you on?
It’s an Ubuntu (18 lts) with lightdm → xfce. The situation reminds me of recent firefox upgrades which remove a bunch of familiar menus which you must search to enable. Idiots.
Update: I ment mozzila with the idiots remark!
Update 2: Sigh. This is not going to help. I can’ even provoke the crash that takes place on ‘ordninary’ deploy / run.
Update 3: So the menus issue is resolved (not used by all apps but many  xfce4-appmenu-plugin … looks like I was over zealous in reducing xfce’s footprint.
Update 4: oh man. nope, it’s an application setting. Hmm. It did fix the menus with another (claws-mail) app. Oddd.
Ah. Ok, removed the appmenu plugin, rebooted and QT has it’s menus. What the?
Thanks for the help. The only thing that didn’t work is the qml live debugging. the qml debugger yes, but not the qmllive workbench.
If you want to connect with QmlLive to an application started outside the IDE, you need to use qmlliveruntime-sailfish on the device to start your application - check QML Live Coding With Qt QmlLive | Sailfish OS Documentation.
Cool, I knew I had read that before ![]() Thanks! EDIT: unfortunately it doesn’t get me far since the connect back from the qmlbench causes the app to die.
Thanks! EDIT: unfortunately it doesn’t get me far since the connect back from the qmlbench causes the app to die.
Had you seen this (which got me into this mess) :
Presumably I’m instantiating c++ objects in an unsafe way (I wanted a ‘generated’ startup sound that uses sdl for generation).
As it is now, it’s easier for me to just run the app from a terminal and use stdout. Not ideal :0